H1
Hue palette
Do different sequential hue families carry stable semantic advantages for foundation models?
Limited, inconsistent effectCHROMA · A controlled benchmark for machine map understanding
CHROMA measures how hue, color ordering, and lightness contrast shape foundation models' spatial reasoning on sequential choropleth maps.
The question
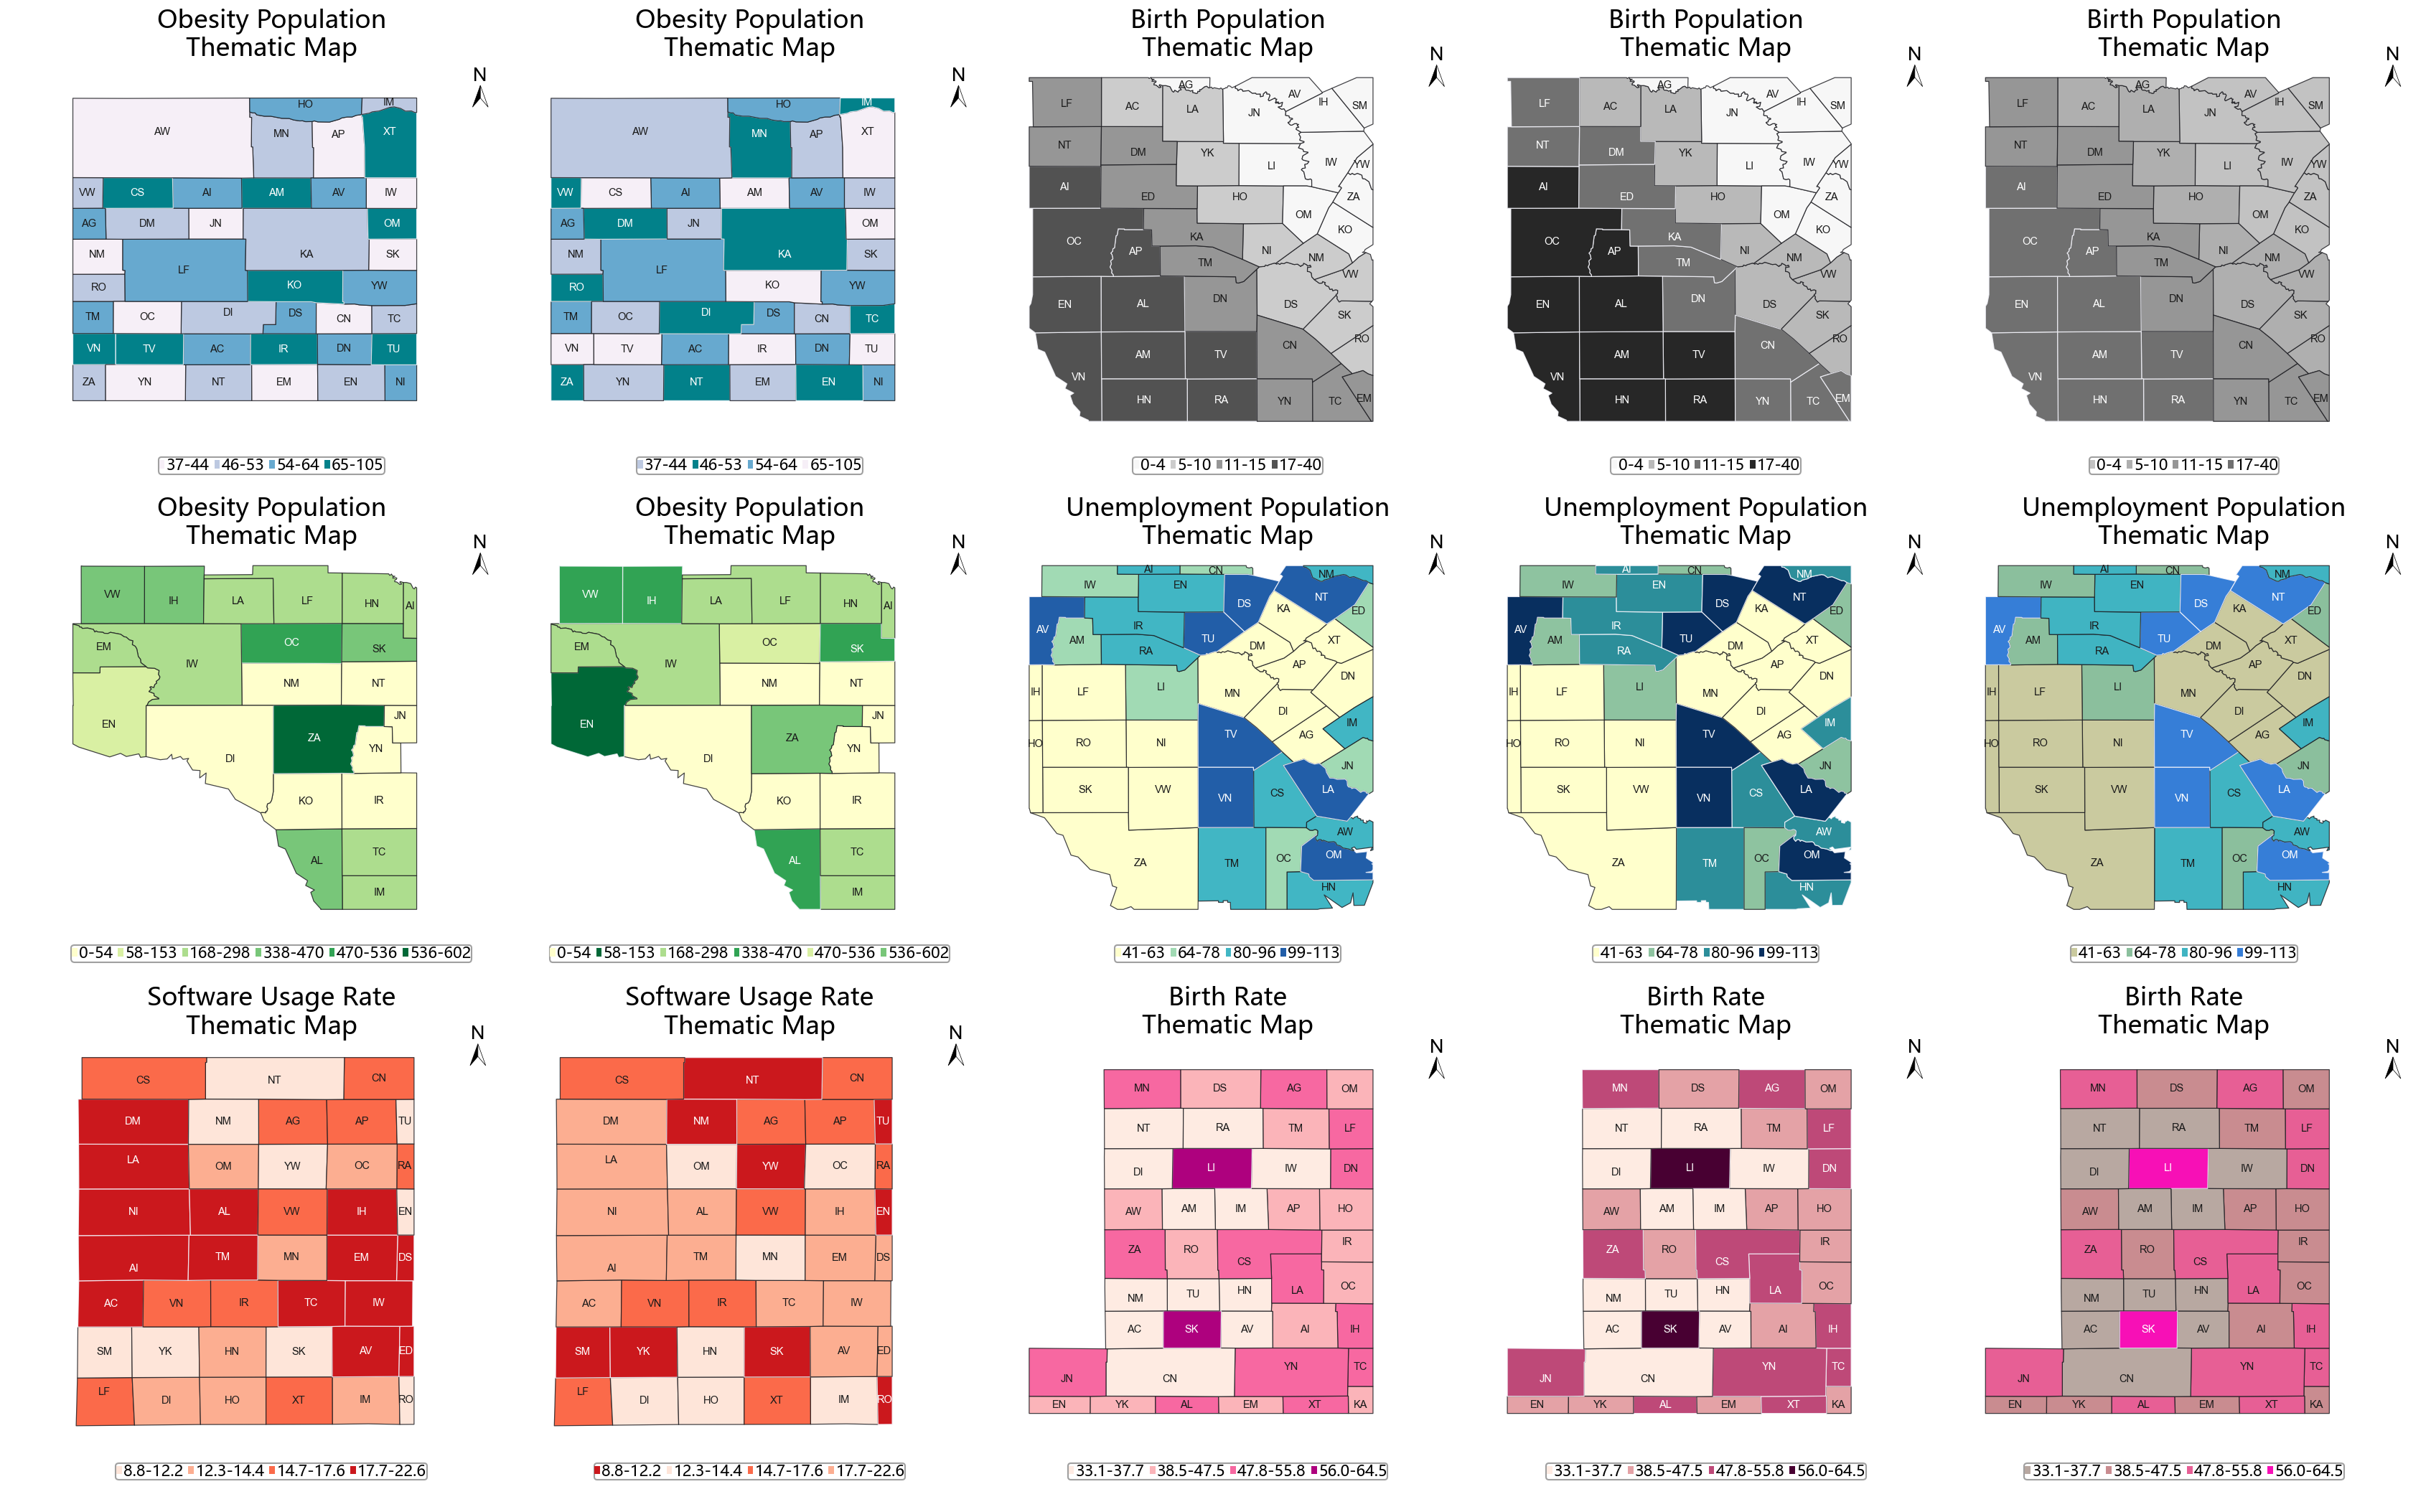
CHROMA turns three classical color-design principles into controlled experiments, holding geography, values, questions, and rendering constant while changing only the visual encoding.
Do different sequential hue families carry stable semantic advantages for foundation models?
Limited, inconsistent effectDoes preserving the familiar light-to-dark sequence help models compare and rank regions?
Large, systematic effectHow much class separation is enough for reliable machine-readable thematic values?
Asymmetric threshold effect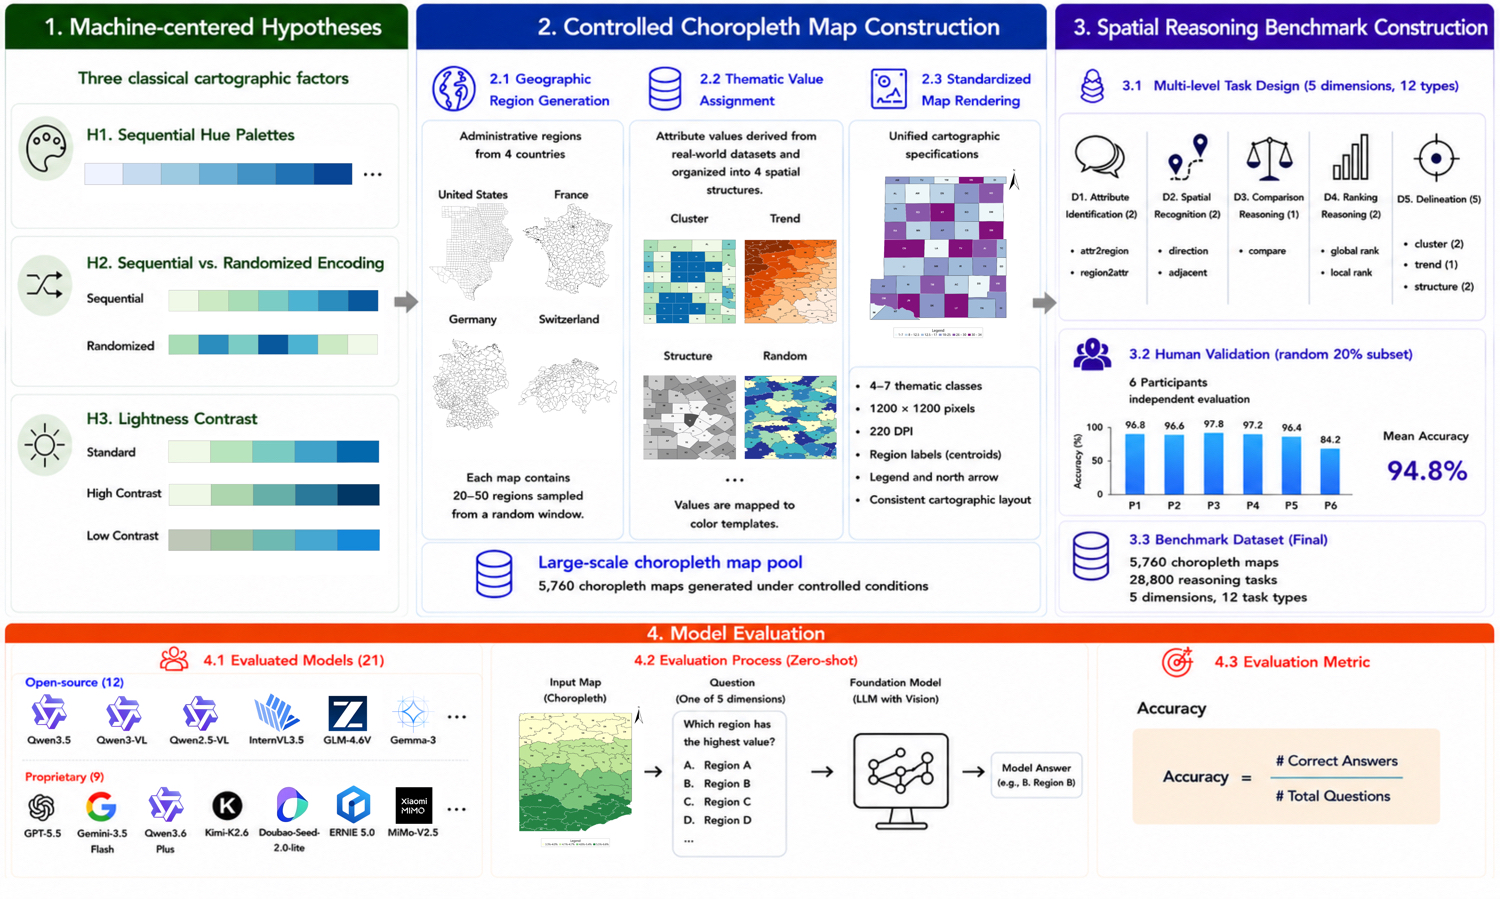
The benchmark
Every controlled map is paired with questions that move from reading a single region to recognizing higher-order spatial patterns.
Match regions to thematic classes and classes to regions.
Resolve direction and adjacency between geographic regions.
Compare thematic magnitudes between specified regions.
Find local or global extrema and rank regions by value.
Recognize clusters, trends, and spatial structures.
Core results
Models care far more about whether colors preserve magnitude and remain separable than about which hue family a map uses.
Mean accuracy falls from 53.7% to 44.5% when class colors are randomized. Ranking suffers most: D4 drops by 24.6 points.
Across 18 sequential palettes, mean accuracy ranges from 51.2% to 55.5%. The winner changes across models and task types.
Average accuracy changes from 55.3% at standard contrast to 55.8% at high contrast and 53.3% at low contrast.
Main experiment · Accuracy (%)
H2 compares sequential and randomized ordering. H3 compares standard, increased, and reduced lightness contrast.
| Model | H2 · Color ordering | H3 · Lightness contrast | |||
|---|---|---|---|---|---|
| Sequential | Randomized | Standard | High | Low | |
| Qwen3.5-9B | 68.6 | 53.6 | 70.8 | 70.9 | 67.6 |
| Qwen3.5-4B | 62.6 | 49.1 | 63.6 | 63.6 | 60.2 |
| Qwen3.5-2B | 49.5 | 41.4 | 51.2 | 52.0 | 49.1 |
| Qwen3-VL-8B-Instruct | 62.1 | 48.0 | 63.3 | 64.1 | 60.3 |
| Qwen3-VL-4B-Instruct | 58.8 | 45.8 | 59.7 | 60.2 | 56.7 |
| Qwen3-VL-2B-Instruct | 43.4 | 36.3 | 44.5 | 44.7 | 42.6 |
| Qwen2.5-VL-7B-Instruct | 51.0 | 41.6 | 52.2 | 53.1 | 50.1 |
| Qwen2.5-VL-3B-Instruct | 44.2 | 38.0 | 46.2 | 47.4 | 45.1 |
| GLM-4.6V-Flash | 64.3 | 51.9 | 66.5 | 66.6 | 62.7 |
| Gemma3-12B-IT | 35.7 | 35.3 | 36.8 | 36.7 | 36.2 |
| Gemma3-4B-IT | 29.6 | 29.7 | 29.6 | 29.4 | 29.8 |
| InternVL3.5-8B | 59.1 | 46.3 | 62.2 | 64.2 | 60.4 |
| InternVL3.5-4B | 58.6 | 47.0 | 59.9 | 60.9 | 57.0 |
| InternVL3.5-2B | 41.2 | 35.4 | 41.0 | 41.9 | 40.2 |
| Kimi-K2.6 | 78.9 | 65.1 | 80.9 | 81.8 | 79.4 |
| Qwen3.6-plus | 44.3 | 41.1 | 46.9 | 47.7 | 44.7 |
| Doubao-Seed-2.0-lite | 47.8 | 44.9 | 49.5 | 50.1 | 49.0 |
| MiMo-V2.5 | 49.4 | 38.3 | 50.7 | 51.3 | 49.4 |
| ERNIE 5.0 | 40.4 | 37.2 | 43.3 | 43.1 | 43.2 |
| Gemini-3.5-Flash | 77.9 | 58.9 | 80.4 | 80.5 | 76.7 |
| GPT-5.5 | 59.7 | 49.2 | 61.4 | 61.6 | 58.6 |
| Average | 53.7 | 44.5 | 55.3 | 55.8 | 53.3 |
For H1, averages across the 18 hue palettes range from 51.2% (Purples) to 55.5% (YlGn); the complete palette-by-model table is available in the paper.
Ordering effect across models
Most tested systems lose accuracy when the same palette is detached from its natural ordinal progression. Human readers remain much more robust.
Contrast effect across models
Reducing contrast hurts consistently, but extra contrast beyond an already separable standard condition adds comparatively little.
Design implications
Use the familiar directional convention, not merely any monotonic ordering. Reversing the convention can be especially harmful for comparison and ranking.
Avoid compressed lightness steps. Once adjacent classes are clearly distinguishable, further expansion offers diminishing returns.
Because no hue family is consistently best for machines, hue can prioritize human accessibility, semantics, and context without sacrificing a universal model preference.
Matched 2×2 ablation
The same maps, questions, values, and answer choices are tested while attribute values and spatial relations are independently supplied as clean text. This separates color-and-legend decoding, spatial reasoning, and their integration without introducing OCR confounds.
What it shows
Can models learn around it?
LoRA adaptation substantially raises overall accuracy, yet the relative sensitivity to randomized ordering and insufficient contrast remains. Better models and better maps are complementary, not interchangeable.
Open resources
Methods, analyses, robustness checks, and appendices.
Maps, JSON annotations, and evaluation records.
Use the DOI to reference the current arXiv release.
Citation
@article{sun2026chroma,
  title   = {Toward AI-Friendly Cartography: Understanding How Color Design Influences Foundation Model Spatial Reasoning on Sequential Choropleth Maps},
  author  = {Sun, Yonghe and Liu, Zhenjia and Liao, Hua and Xu, Wenjia and Yang, Nai and Dong, Weihua and Wei, Zhiwei},
  journal = {arXiv preprint arXiv:2608.15736},
  year    = {2026},
  doi     = {10.48550/arXiv.2608.15736}
}